Transformer Capacity Monitor
A fixed-rules monitor for the 500 distribution transformers of Tompkins County, NY: statistical process control on every unit's own history, a capability check against its nameplate rating, a heat-pump growth estimate, and a review app where a named engineer records the decision on each exception.
A working recreation you can click through
Decision rules that fired this period · first matching row wins
| Row | Tier | Condition | Reason shown to the reviewer | Units |
|---|---|---|---|---|
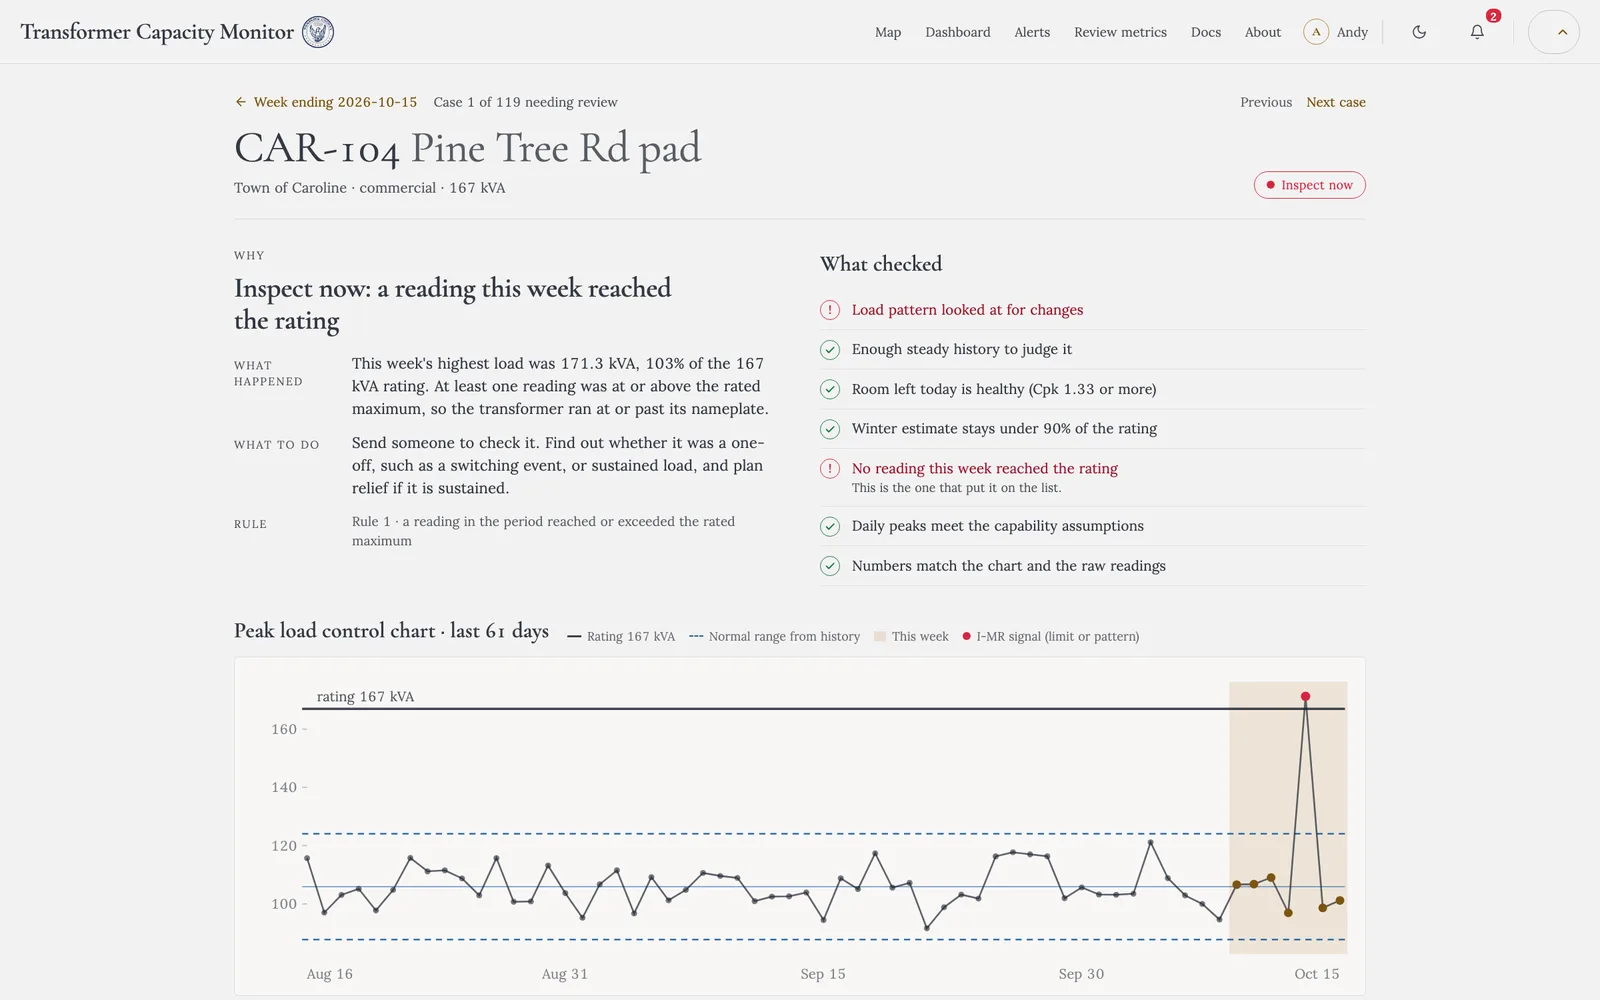
| 1 | Inspect now | period_peak_ratio >= 1.0 | A reading in the period reached or exceeded the rated maximum | 9 |
| 2 | Inspect now | stability == 'signal' and inspect_signals >= 1 | Sustained shift this period: a run rule fired (8 in a row on one side of the centre line or 2 of 3 beyond 2 sigma) | 7 |
| 3 | Inspect now | stability == 'signal' and outlier_signals >= 3 | Repeated outliers this period (3 or more days beyond 3 sigma or with a moving-range spike) | 6 |
| 4 | Review needed | stability == 'signal' | Chart signal: a few outliers; the load pattern may have changed and capability is not calculated until it is explained | 30 |
| 5 | Review needed | stability == 'insufficient_history' | Not enough stable history to judge the load pattern; a person decides | 9 |
| 9 | Review needed | cpk < 1.33 | Low Cpk against the rated maximum (playbook threshold 1.33) | 24 |
| 10 | Review needed | cpk_ci_low < 1.33 | Uncertain Cpk: the lower 95% confidence bound is below 1.33 | 14 |
| 11 | Review needed | forecast_ratio >= 0.9 | Forecast peak near or above the rated maximum (0.9 of rating or more) | 20 |
| 13 | Within limits | otherwise | Every transformer needs a defined outcome; first matching row wins | 381 |
This is the project's own report for the period ending 2026-10-15: all 500 transformers with their tier, the rule that set it, their 60-day control charts and capability figures, drawn over the real municipal boundaries over Esri satellite imagery. The data is the synthetic set the project ships with. Decisions you record here stay in your browser; apart from the map tiles, nothing is fetched from or sent anywhere.
Overview
A fixed-rules monitor for the 500 distribution transformers of Tompkins County, NY, built for Cornell's MAE 5930 Systems Engineering with Spencer Witt, Daoming Zhang and Abdullah Saleh Alnamlah. It runs statistical process control on every unit's own history, checks capability against the nameplate rating, estimates winter load as heat pumps spread, and routes the exceptions to a review app where a named engineer records the decision on each one.
Every statistic and every tier is a written rule. No model takes part in any number or decision, and the tool never touches equipment.
Problem
Distribution transformers are the last step between the grid and a street, and they are sized for the load a street used to have. Heat pumps change that: a neighbourhood that electrifies its heating can push a transformer past its rating on a cold evening years before anyone planned to replace it.
A utility already has the hourly readings to see this coming. But 500 transformers produce more charts than one planner can read every week, and a single "utilisation %" number hides the difference between a unit that is busy but steady and one whose load pattern has changed.
Solution
A pipeline that reads every transformer with the same written rules, three times a week, and shows the engineer only the exceptions, with the reason in plain words and an auditable record of what was decided.
The rules live in one file, rules/playbook.json, and a 13-row decision table. The documentation is rendered from the same file, so the engineer, the code and the docs can never disagree.
Three tiers, first matching rule wins
| Tier | When |
|---|---|
| 🔴 Inspect now | A reading reached the rating; a Western Electric run rule fired this week (8 in a row on one side, 2 of 3 beyond 2σ); or three or more days fell outside the control limits |
| 🟠 Review needed | A few outlier days; thin or uncertain headroom (Cpk below 1.33, or its 95% lower bound below 1.0); a winter estimate at 90% of the rating or more; chart assumptions failed; not enough history yet |
| 🟢 Within limits | Everything else |
How a transformer gets its colour
- Control chart. One value per day, the daily peak, on an individuals and moving-range (I-MR) chart built from the transformer's own 60-day baseline. Centre = mean; limits = mean ± 2.66 × MR̄; four run rules. The limits describe how the unit normally behaves, not the rating.
- Headroom today. For a stable chart, a one-sided capability index against the rating, Cpk = (rating − mean) / 3σ with σ = MR̄ / 1.128, plus a 95% interval (Bissell 1990). Withheld when a lag-1 autocorrelation or normality screen fails: a Cpk you can't trust is worse than none.
- Winter estimate. This week's peak + customers × (forecast heat-pump share − today's share) × kW per heat pump ÷ power factor, from the planning forecast for the transformer's area. Always labelled as an estimate.
- Decision table. Thirteen rows evaluated in order against those facts; the first match sets the tier and the sentence shown to the reviewer.
- Review gate. Every flagged transformer needs a recorded decision (approve, override or reject, with notes) from the named reviewer before the week's report can be finalized.
A separate modeled layer, the IEEE C57.91 top-oil and hot-spot thermal model driven by the recorded loads and outside-air temperature, powers a 3D cutaway of the transformer and a heat view on the map. It is for understanding only: no rule reads it, and every modeled number is badged as such.
Architecture
The pipeline, as it runs. Apache Airflow schedules the run (0 6 * * 1,3,5, America/New_York), read from the playbook so the documented schedule is the one that runs. A readiness sensor first waits for all four feeds to exist and for readings to reach the period end; a late meter export delays the run instead of scoring a short week. Then 15 numbered steps run as separate tasks:
load readings → assets → boundaries → forecasts → align inputs → completeness gate → stability check → chart + capability + forecast + decision → review gate → save report → complete.
The completeness gate refuses mismatched inputs (a boundary file valid for another period, a transformer with no rating, a day with no readings) and raises an alert rather than publishing a partial result. A rerun of the same period replaces its results; every attempt stays in the run log.
The review app. A small Flask app with a light typographic theme and a dark mode:
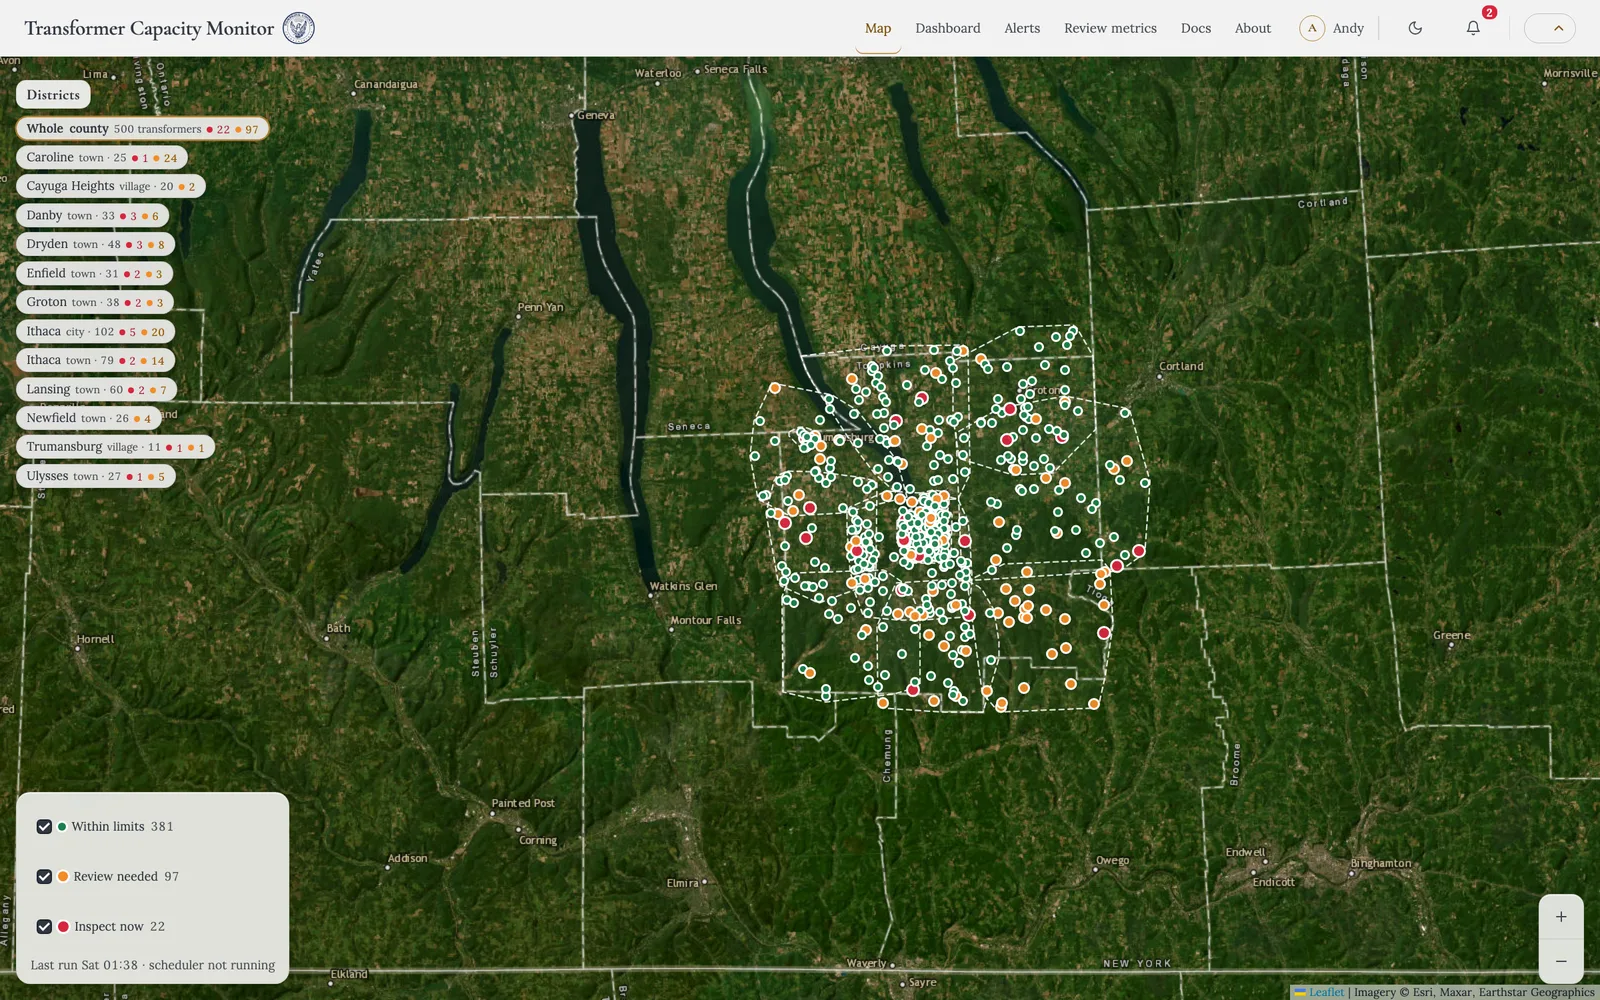
- Map: every transformer as a dot coloured by tier over the county's 12 towns and villages. Click for a compact control chart and the rule-based sentence; double-click a town to focus it. A recorded-day heat view with an hour scrubber, and a seasonal view that follows typical hourly outside air for any month, including a modeled winding-temperature metric.
- Review page: why the unit was flagged, what was checked, the I-MR and moving-range charts, headroom against the rating, the 3D cutaway with oil, winding and air temperatures pinned on the model and a week-long scrubber, and the decision form. Flagged cases are a checklist; decided ones drop off the map's sidebar.
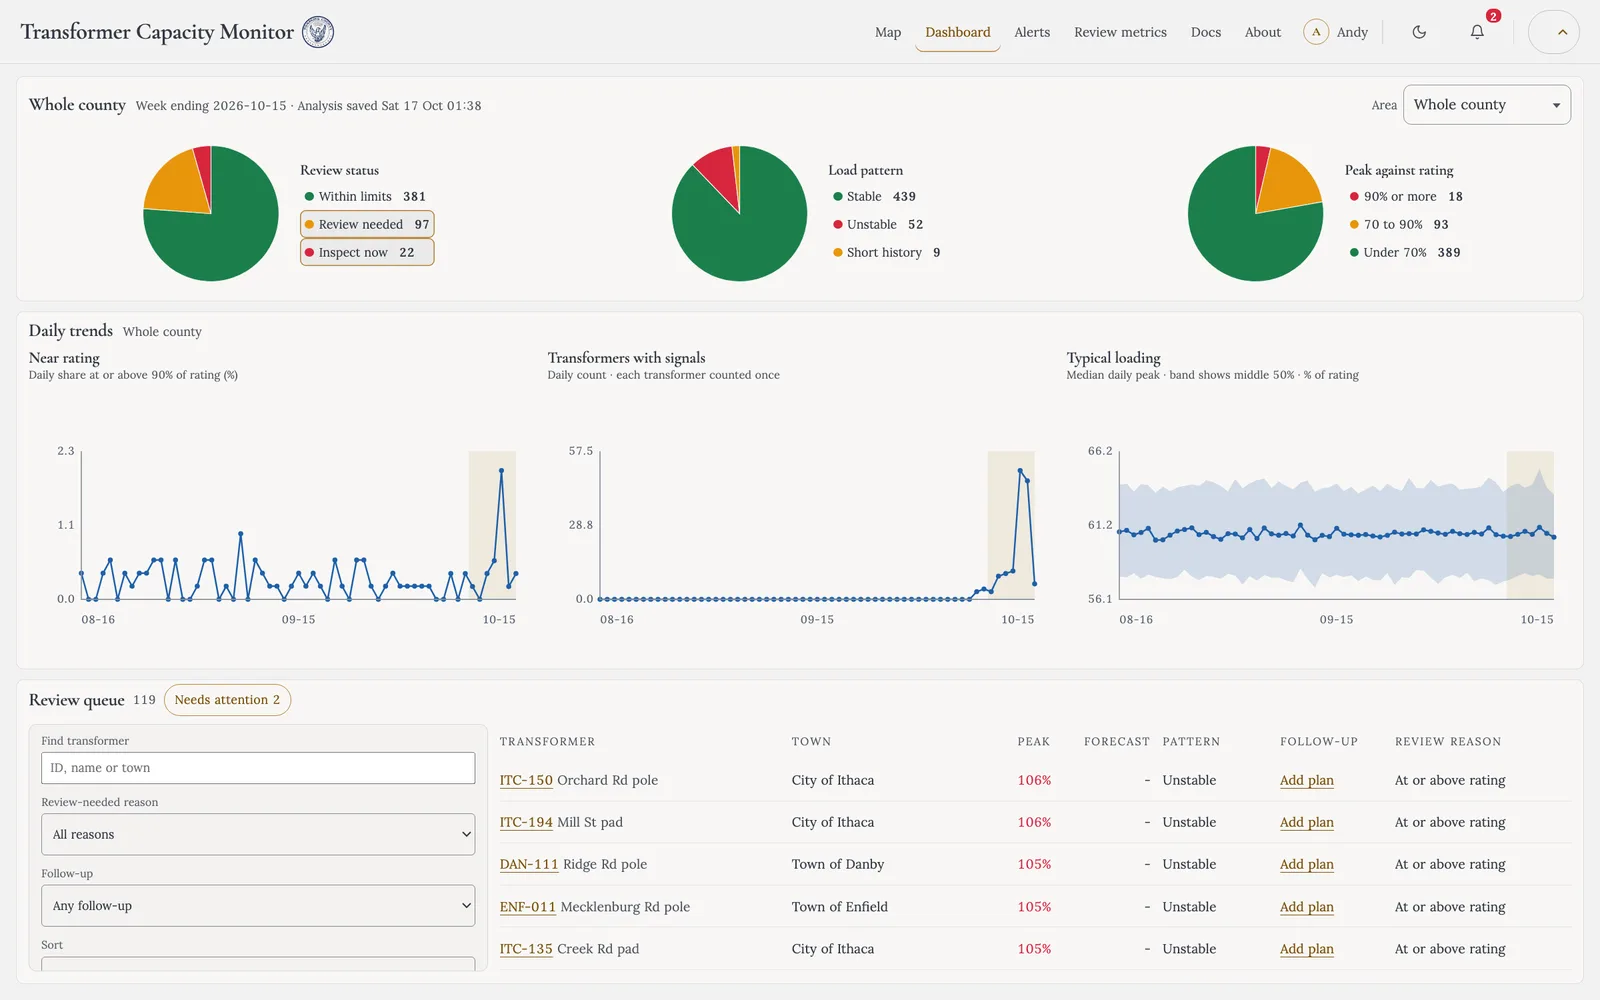
- Dashboard, Alerts, Review metrics: week-level counts, the plain-language alert log (what happened, what to do, technical detail folded away), and reviewer statistics.
- Docs and About: rules and thresholds rendered live from the playbook, data codebook, API, how to cite, setup.
Optional and off by default: a Claude Haiku rewrite of alert and summary text via the local claude CLI, display-only, with the rule-based text always kept as the fallback.
Data
Everything bundled is synthetic: 500 transformers, 886k hourly readings over 75 days, an outside-air feed, NYS municipal boundaries, and a heat-pump forecast, generated from a fixed seed with planted cases (a sustained shift, a spike, repeated outliers) that exercise each rule. The codebook describes every column and how to collect it for real; replace the four CSV/GeoJSON feeds and run a period.
Tech Stack
- Pipeline: Python (standard library only), Apache Airflow, SQLite
- Review app: Flask, Leaflet for the map, three.js for the 3D cutaway
- Delivery: deployed to Posit Connect from GitHub Actions on every push to main
- Methods: Western Electric run rules, I-MR control charts (Montgomery), Bissell (1990) capability intervals, Jarque–Bera normality test, IEEE Std C57.91-2011 thermal model
Results
- 4.8k lines of Python, 65 tests
- 15 pipeline steps, 13 decision rules, 3 tiers, 4 run rules
- Latest demo week: 500 transformers → 22 inspect now · 97 review needed · 381 within limits
What I took from it
- Fixed rules beat clever models when someone has to sign. Writing the thresholds down in one JSON file and rendering the docs from it meant the engineer, the code and the documentation could never disagree.
- Refuse, don't guess. The completeness gate that stops a run on a stale boundary file felt like friction until it caught exactly that in testing.
- Separate measured from modeled. Everything the thermal model produces is badged; nothing a rule decides depends on it.
A closer look
- AI product · Decision toolingBlueprint: the Agent Architecture Guide
- Multi-agent · FinanceDeepDiligence
- LLM pipeline · HealthcarePolicy-to-Rules Engine
- Multi-agent · SalesLead Generator Proposal Engine
- Agentic AICornell Personal Assistant
- AutomationJob Listings Tracker
- AutomationInvoice Generator
- GenAI · ConversationalTravel Agent GPT